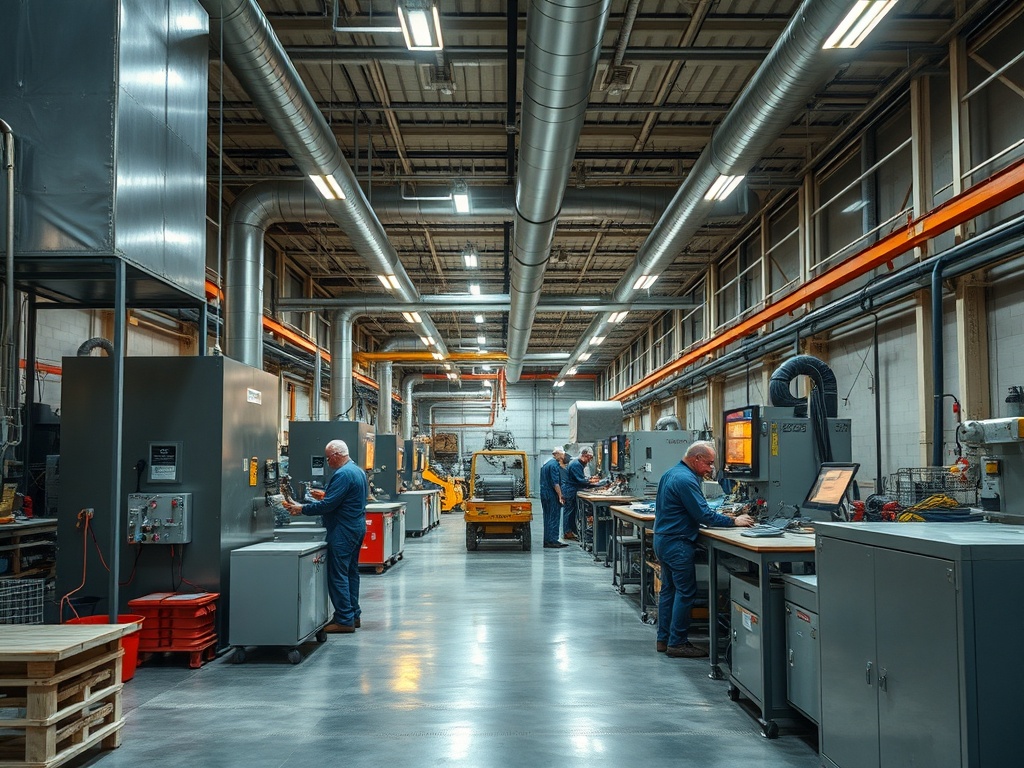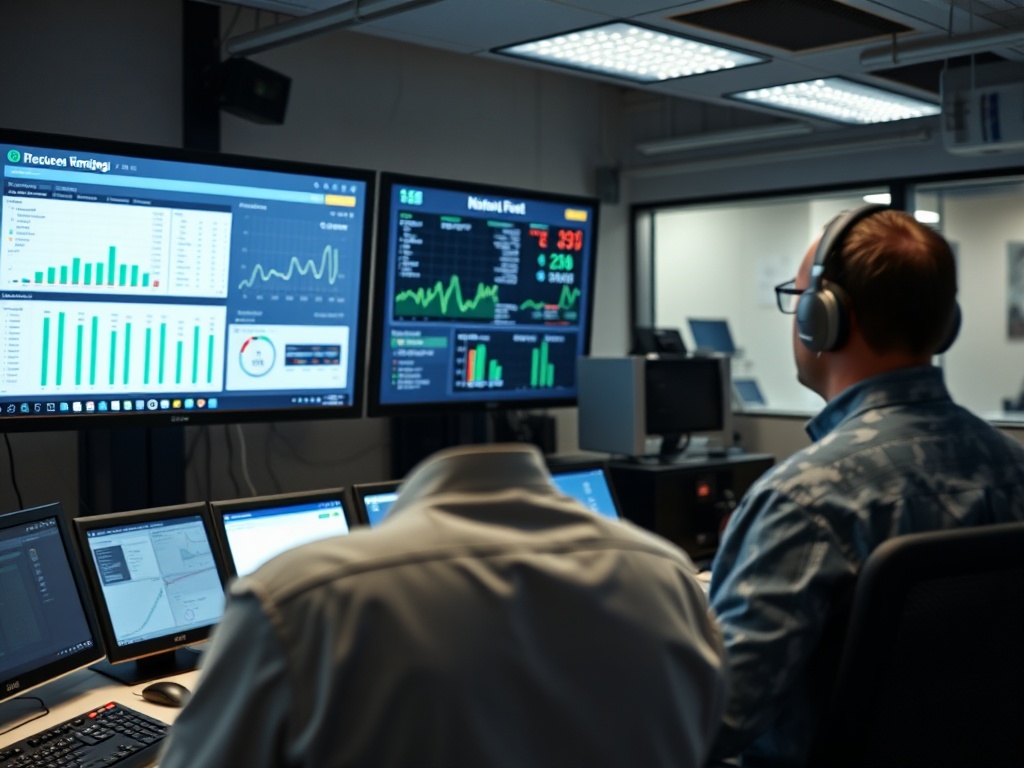
Energy dashboards help facility teams turn building data into operating information they can act on. When dashboards combine meter data, HVAC trends, schedules, weather, alarms, and key performance indicators, they can make abnormal runtime, simultaneous heating and cooling, sensor drift, off-hours operation, and other performance problems easier to detect.
- A useful dashboard is an operations tool, not a wall of charts.
- Start with a small set of HVAC questions and display only the data needed to answer them.
- Dashboards create value when facility staff have a process for investigating exceptions, correcting faults, and verifying the result.
What an Energy Dashboard Sits On Top Of
The U.S. Department of Energy describes energy management information systems, or EMIS, as software tools that monitor, analyze, and sometimes control building energy use and system performance. DOE’s overview of energy management information systems explains that EMIS can combine utility data, meters, building automation systems, weather, distributed energy resources, and other facility data.
A dashboard is one way to present that information. It may show daily electricity use, HVAC runtime, temperatures, alarms, demand, equipment status, or calculated KPIs. The underlying data can come from a building automation system, utility meter, submeters, fault-detection platform, cloud application, or a combination.
The dashboard itself does not improve HVAC performance. It helps people notice patterns and decide where to investigate.
Begin With Operating Questions
Facility teams often make dashboards too broad. A better starting point is a short list of questions such as:
- Which buildings or air handlers are running outside scheduled hours?
- Which zones are regularly outside their temperature range?
- Are cooling and heating operating at the same time?
- Are economizer dampers responding to outdoor conditions?
- Which units have unusually long fan or compressor runtime?
- Did energy use return to normal after a repair or schedule change?
Each question should map to a few data points. If a chart does not support a decision, it may not belong on the first screen.
KPIs Turn Raw Points Into Signals
DOE’s page on EMIS capabilities explains that key performance indicators can combine multiple data points and compare them with historical or expected values. This is more useful than showing thousands of raw building-automation points without context.
| HVAC question | Example dashboard signal | Possible investigation |
|---|---|---|
| Is equipment running after hours? | Fan or compressor runtime outside schedule | Schedule override, sensor issue, occupant request |
| Is outdoor air being used correctly? | Damper position versus outdoor condition | Economizer sequence, actuator, sensor calibration |
| Are zones fighting each other? | Heating and cooling commands at the same time | Setpoints, deadbands, reheat logic, sensor errors |
| Did a repair work? | Before-and-after runtime or energy trend | Verify fault correction and persistence |
| Is a unit drifting? | Supply-air temperature or pressure trend | Coil, airflow, control, sensor, or equipment condition |
The exact KPI should reflect the system design. A single threshold copied across every building can create false alarms.
Trend Data Makes HVAC Behavior Visible Over Time
A snapshot tells you what the system is doing now. A trend shows what it has been doing for hours, days, or seasons.
Trend lines can reveal recurring morning warm-up issues, weekend operation, a damper that sticks only at certain positions, a sensor that slowly drifts, or a compressor that runs longer as outdoor temperature rises. They can also show whether a problem began after a control update, construction project, tenant change, or equipment replacement.
For commercial systems with economizer cooling, trending outdoor conditions, damper command, mixed-air temperature, and compressor status can help verify whether the economizer is reducing mechanical cooling when expected.

Dashboards Are Strongest When Paired With Fault Detection
Some EMIS platforms include automated fault detection and diagnostics. These tools apply rules or models to operating data and flag conditions that deserve attention. Examples can include simultaneous heating and cooling, leaking valves, sensor disagreement, schedule faults, or poor economizer performance.
Automation can reduce the time required to scan trends, but it does not remove the need for field verification. A software fault may be caused by bad sensor data, an incomplete control point, or a system configuration that differs from the rule’s assumptions.
A useful workflow is: detect, prioritize, investigate, correct, and verify.
Prioritize Exceptions by Impact and Confidence
Facility teams can be overwhelmed when a new analytics platform produces hundreds of alerts. Start by ranking issues according to operational impact, persistence, and confidence in the data.
A high-priority HVAC exception might affect many zones, run for long hours, create a comfort problem, or involve critical equipment. A low-priority item might be a short, explainable deviation.
Where energy savings are estimated, keep the method transparent. Avoid treating a software estimate as a guaranteed utility-bill reduction. Weather, occupancy, production, rates, and other building changes can affect before-and-after comparisons.
Data Quality Is an HVAC Maintenance Issue Too
A dashboard can be visually polished and still be wrong. Sensor calibration, point mapping, unit conversion, timestamps, equipment naming, and network reliability all affect what the operator sees.
Common data problems include sensors stuck at one value, swapped points, missing trends, incorrect units, duplicated equipment names, and schedule data that does not match actual occupancy.
The same principle applies to makeup air systems. If exhaust status or airflow is not represented correctly, a dashboard may show the makeup air unit as “normal” while the building pressure is wrong.
Design Different Views for Different Users
An energy manager, HVAC technician, operations supervisor, and executive may need different views of the same data. DOE notes that dashboard interfaces can be configured around user roles.
A technician may need supply-air temperature, damper position, valve command, and fan status. An energy manager may need whole-building load, after-hours use, and weather normalization. An executive may need a small set of portfolio KPIs and verified project results.
Trying to put every audience on one screen usually produces clutter.
Use Dashboards to Verify Maintenance, Not Replace It
A dashboard can identify a fan that runs continuously, but it cannot tighten a loose belt, clean a coil, repair a drain, or calibrate a sensor. Analytics should guide field work and help verify outcomes.
For example, after a technician corrects an airflow problem, the team can compare static pressure, fan speed, zone temperatures, and runtime before and after the work. After a schedule change, the dashboard can confirm that equipment actually shuts down at the intended time.
This closes the loop between digital information and physical maintenance.
Build a Small, Repeatable Review Routine
A practical operating rhythm might include a daily exception screen, a weekly HVAC review, and a monthly look at longer trends. The frequency should match staffing and building criticality.
Assign ownership. Every alert category should have someone responsible for deciding whether it is actionable, documenting the response, and closing the issue. Otherwise, the dashboard becomes another inbox that no one trusts.
Lawrence Berkeley National Laboratory’s work on using dashboards to improve energy and comfort describes dashboards as tools that can support benchmarking, anomaly detection, off-hours analysis, and operational decisions. The value comes from turning information into action.
Treat the Dashboard as Part of the Operating Process
The best dashboard is not necessarily the one with the most sensors or graphics. It is the one facility staff use to answer recurring questions, prioritize work, and verify that corrections persist.
For informational and educational purposes only; this article does not constitute HVAC, controls-engineering, cybersecurity, financial, code, or legal advice. Building-specific analytics and control changes should be reviewed by qualified facility, HVAC, and controls professionals.
Choose three HVAC questions your team repeatedly struggles to answer, build one dashboard view around those questions, and establish a weekly process for investigating and closing the exceptions it reveals.